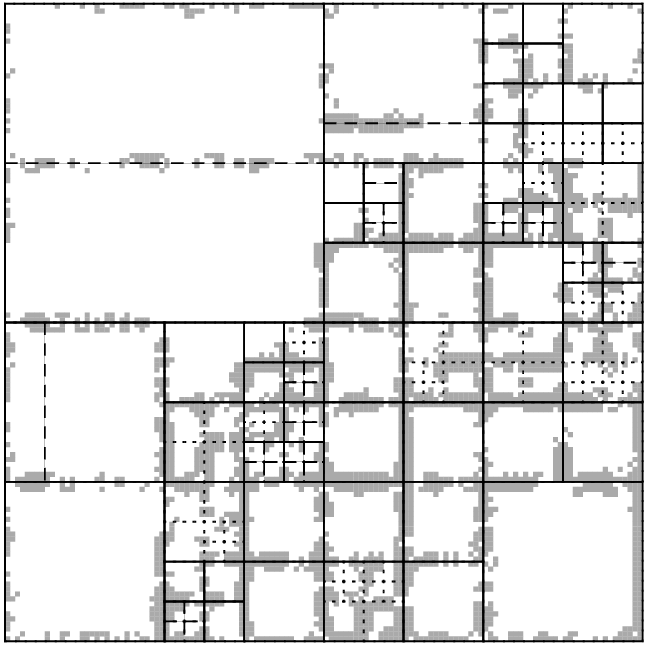
Example for deblocking of 2×2 CTBs.
Besides the original area of the picture from the test sequence and the corresponding decoded reconstruction, the samples along the prediction block and transform block boundaries which are modified by the deblocking filter are visualized. For comparison, the same region without the application of the deblocking filter is shown as well.
-
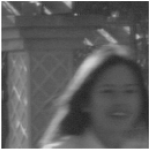
- Original

-

- Deblocked pixels
-
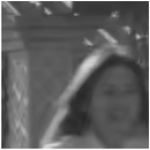
- Reconstructed

-

- No deblocking

(CB: solid lines, PB: dashed lines, TB: dotted lines)